
Key takeaways for managers (TL;DR)
- Pour cost represents the percentage of beverage sales spent on beverage stock. For most high-volume bars and restaurants, a healthy overall target sits between 18% and 24%.
- Theoretical pour cost reflects what you should have spent according to POS sales data, while actual pour cost measures what you actually used based on physical stock audits.
- The variance gap between theoretical and actual pour cost (typically 3% to 6% in venues relying on monthly manual counts) is where thousands in monthly net profit vanish.
- Visual estimation of open bottles and unmetered free-pouring are the primary drivers of beverage variance, compounding invisibly until the end-of-month P&L arrives.
- Switching from monthly pen-and-paper clipboards to weekly Bluetooth scale counts shrinks variance by 2% to 4%, delivering immediate gross margin recovery without raising drink menu prices.
1. The Single Most Critical Number on Your Bar P&L
In commercial food and beverage management, labor and cost of goods sold (COGS) dictate whether a profitable Friday night actually translates into cash in the bank. While food cost is notoriously subject to spoilage, volatile protein markets, and prep yield losses, beverage inventory is remarkably resilient. Unopened spirits do not decay, kegs hold pressurized stability for weeks, and high-proof alcohol retains shelf life indefinitely.
Yet despite this inherent physical stability, beverage programs routinely bleed margin.
The diagnostic metric every food and beverage director, bar owner, and general manager monitors is Pour Cost (often termed Beverage Cost Percentage). Understanding this single ratio—and dissecting the gap between what your recipe cards promise versus what your physical inventory reveals—is the fastest route to recovering trapped cash flow.
2. Understanding the Mathematical Formulas
Pour cost can be calculated at two fundamental levels: the individual drink unit level (for menu pricing and cocktail recipe design) and the macro venue operations level (for accounting periods and shift audits).
2.1 Unit Pour Cost (Single Cocktail or Serving)
When creating a new cocktail or pricing a draft beer pour, unit pour cost tells you what percentage of the drink’s net selling price is consumed by ingredients:
Unit Pour Cost (%) =
(Ingredient Cost per Serving / Net Menu Selling Price) * 100
For example, consider a signature Mezcal Paloma:
- 0.04L Artisanal Mezcal: €1.10
- 0.015L Fresh Lime Juice: €0.12
- 0.015L Agave Nectar: €0.08
- 0.09L Pink Grapefruit Soda: €0.45
- Dehydrated Grapefruit Wheel & Salt Rim: €0.15
- Total Recipe Cost: €1.90
- Menu Price (net of tax): €9.50
Unit Pour Cost =
(€1.90 / €9.50) * 100= 20.0%
In this scenario, your gross profit margin on every Paloma rung up is 80.0% (€7.60).
2.2 Macro Venue Pour Cost (Operating Period)
During monthly accounting or weekly inventory reconciliations, you evaluate the entire beverage department across all categories:
Actual Pour Cost (%) =
(Cost of Goods Sold COGS / Total Gross Beverage Sales) * 100
Where COGS is derived from physical inventory counts:
COGS =
Beginning Inventory + Purchases / Deliveries - Ending Inventory
If your venue starts the week with €28,000 in liquor stock, receives €8,500 in distributor orders, and closes the week with €26,200 in counted stock, your COGS is:
COGS =
€28,000 + €8,500 - €26,200= €10,300
If your point-of-sale system logged €46,800 in net beverage sales during that same week, your actual pour cost was:
Actual Pour Cost =
(€10,300 / €46,800) * 100= 22.0%
3. Industry Benchmarks by Beverage Category
A common mistake among new operators is applying a single blanket target (such as “20%”) across the entire drink menu. In practice, each beverage category operates under completely different shelf life, labor, and capital dynamics:
| Category | Typical Pour Cost Benchmark | Gross Margin Target | Primary Risk Factor |
|---|---|---|---|
| Spirits & Premium Liquor | 14% – 18% | 82% – 86% | Over-pouring, unmetered free-pours, staff theft |
| Craft Cocktails | 15% – 20% | 80% – 85% | Pre-batch waste, unrecorded spillage, ice melting dilution |
| Draft Beer (Kegs) | 20% – 24% | 76% – 80% | Line foaming, line-cleaning waste, temperature spikes |
| Bottled & Canned Beer | 24% – 28% | 72% – 76% | Broken glass, expired stock, staff shift drinks |
| Wine by the Glass | 28% – 35% | 65% – 72% | Bottle oxidation after 48h, generous 180ml pours |
| Wine by the Bottle | 30% – 40% | 60% – 70% | Slow cellar turnover, dead capital stock |
| Soft Drinks & Coffee | 8% – 14% | 86% – 92% | Syrup box calibration, uncharged soda gun refills |
Why Draft Beer Sits Higher than Spirits
Draft beer typically runs at 20% to 24% pour cost. A keg of fresh pilsner or IPA produces 5% to 8% natural line waste through morning line clearing, foam adjustments during keg changes, and faucet dripping.
The Wine-by-the-Glass Rule of Thumb
Commercial bar operators generally price a single glass of wine to cover the wholesale purchase cost of the entire bottle. If a bottle costs your bar €7.00 wholesale and yields 5 standard 150ml glasses, pricing each glass at €7.50 to €8.00 ensures that the first glass sold covers the bottle cost. The remaining four glasses generate pure gross margin, cushioning against open bottles that oxidize before finishing.
4. The Critical Concept: Theoretical vs. Actual Pour Cost
If your recipe costing spreadsheet claims your menu averages 19.2%, but your monthly accountant’s report shows you ran at 24.8%, you have a 5.6% variance gap.
Beverage Variance =
Actual Pour Cost - Theoretical Pour Cost
- Theoretical Pour Cost (Ideal): What your beverage cost should have been if every milliliter of alcohol rung up on the POS register was poured to the exact recipe specification, with zero spillage, zero complimentary drinks, and zero unaccounted shrinkage.
- Actual Pour Cost (Real): What your beverage cost actually was, as verified by real inventory consumption on the bar shelves.
The Real-World Dollar Impact of a 4% Gap
Consider a medium-sized nightclub, hotel lounge, or high-volume urban cocktail bar generating €60,000 in monthly beverage sales:
- At an ideal theoretical cost of 20.0%, monthly COGS equals €12,000.
- If the venue actually runs at 24.0% due to loose pouring and unrecorded bottles, monthly COGS jumps to €14,400.
A 4% variance gap wastes €2,400 every single month. That represents €28,800 in evaporated net profit every single year—eroded without customer satisfaction increasing by a single percentage point.
5. The Top 4 Culprits Behind Pour Cost Leakage
When an audit reveals a wide variance between theoretical and actual costs, the root causes almost always trace back to four operational habits:
1. Uncalibrated Free-Pouring During Rush Hours
Bartenders often take pride in free-pouring without a jigger. However, study after study confirms that shift fatigue, loud bass, and packed bars cause free-poured drinks to drift heavy by 8% to 15%. Over-pouring 0.01L on every drink across 2,000 cocktail orders is equivalent to emptying 20 full 1-liter bottles of premium spirits directly down the sink.
2. The Illusion of the “Tenths Method” (Eyeballing)
When staff conduct inventory by picking up open bottles and guessing remaining volume (“looks like a 0.6”), human estimation bias sets in. Because bottle necks narrow sharply, 60% of the glass height often holds only 40% of the liquid volume. Visual guessing conceals chronic shrinkage until the variance explodes at quarterly reconciliation.
3. Unrecorded Comps, Wastage, and Broken Glassware
When a bartender drops a bottle of Hendrick’s Gin or accidentally spills a shaker, they rarely log into the POS terminal to record a “Spill / Breakage” ticket. Without a frictionless way to record shrinkage on the spot, the missing fluid appears as a mysterious shortage during inventory.
4. Infrequent Inventory Intervals (The Monthly Blind Spot)
Bars that count stock once every 30 days leave a massive four-week window of operational blindness. If a keg begins leaking foam, or a case of champagne disappears from the back store on day 3, the manager won’t discover it until day 31. By then, hundreds of shifts have passed and pinpointing the shift responsible is impossible.
6. How Weekly Bluetooth Scale Counts Recover 3% to 5% Margin
The single most effective tool to close the variance gap is frequency powered by speed:
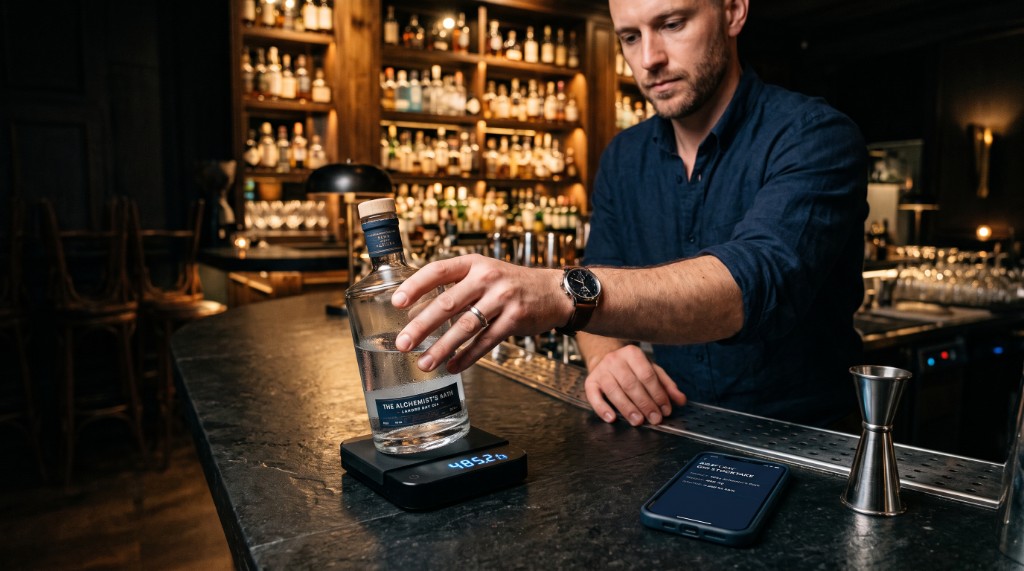
- Sub-second Digital Precision: Placing open bottles on a Bluetooth 5.2 digital scale calculates exact remaining volume instantly via tare subtraction and specific gravity compensation. A 150-bottle bar rail takes under 14 minutes instead of 2 hours.
- Weekly Shift Accountability: When staff know that open inventory is audited every Sunday night or per shift handover, pour habits calibrate instantly. Jiggers are used consistently, spillage is logged honestly, and the feedback loop tightens.
- Automated Zero-Fill Reconciliation: Automated cloud synchronization compares actual scale readings directly against POS depleted counts, instantly highlighting which bottle or taps generated variances.
By removing guesswork from bottle counting, food and beverage operations systematically reclaim their target gross margins—putting thousands in lost cash right back into the business.
§Official sources & references
All benchmarks, tax rules, and percentages cite official regulations and audit reports:
- [1]Cornell Center for Hospitality Research — Beverage Cost Control and Inventory Accuracy
Empirical study evaluating portion discrepancies, bartender pouring habits, and variance recovery mechanisms in high-volume bars.
- [2]National Restaurant Association (NRA) — Beverage Operations and Margin Benchmarks
Industry operational averages documenting pour cost standards across draught beer, wine by the glass, spirits, and craft cocktail programs.
- [3]Tales of the Cocktail Foundation — Sustainable Bar Economics & Recipe Costing
Operator framework for unit costing, pre-batch batching losses, citrus/prep waste, and menu engineering.